As part of my college studies in the MSc of Data Analytics in TUS: Midlands a project I undertook was to explore MongoDB, a NoSQL database, and generate aggregation frameworks on a sample database I generated. This project provided me with an opportunity to explore MongoDB in depth and use the project scenario assigned to me to demonstrate an understanding of its main components and an appreciation of how it differs from Oracle and other SQL databases. This post will go briefly go through the sections of the report, the screencasts recorded are at the end of this post, as is the project documents if you would like to view them.
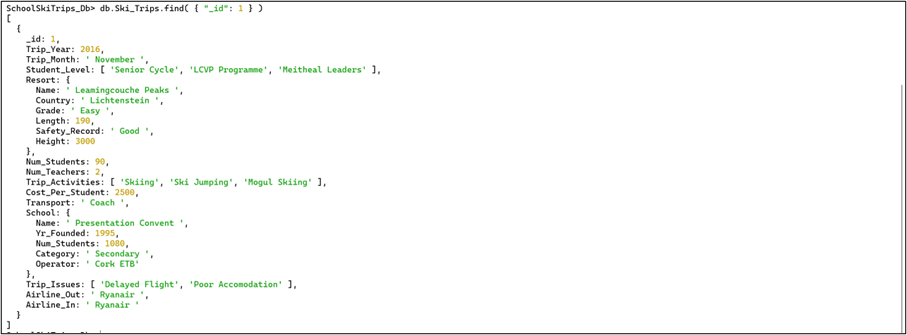
The database was 1000 documents of school ski trips. The database contained 3 arrays and 2 embedded documents. For most fields the RAND operator in excel was used to generate random results, but for the embedded document 'Resort' the fields were linked to provide a more structured approach. After the data was generated, the file was converted to a JSON format and imported to Mongo using the shell.
See below a snip of the first document:
The second requirement of the project was to write a batch of no more than 25 query questions and provide the MongoDB command syntax to answer them in order to demonstrate competence working at the MongoDB Shell – using the Create, Retrieve of CRUD features in MongoDB. All 25 queries had to be executed at the MongoDB Shell and snips of the query and the results pasted into the report document, which can be viewed below.
All of the queries in this section focused on retrieving documents. Examples of Inserts, Updates and Deletes are included also but the vast majority of the queries required dealt with the "R" in CRUD –retrieve documents from the Collection.
An example of one of these queries can be seen below:

The next section of the report required me to write a batch of approximately 8-12 questions to provide evidence of familiarity with the commands and structures in the MongoDB Aggregation Framework. The MongoDB Aggregation Framework is the Mongo DB equivalent of Summary Queries in SQL. They answer questions that require a lot of number crunching and filtering. The aim of this section is to show that I can demonstrate understanding of as many features of Aggregation Framework commands as possible. All examples in this section were tested using the Mongo Shell.
For example here is one of the aggregation queries below:

In this aggregation we are attempting to investigate the positive or negative reviews ski trips obtained when visiting the Abdeen Hills resort in 2018. In the pipeline the match operator is limiting the results to trips in 2018 to 'Abdeen Hills'. The results are then grouped by the trip year, total trip cost, number of activities, number of issues and whether or not the trip review will be positive or negative. The trip review uses the cond operator to insert an if statement. This if statement determines that if the number of activities is greater than the number of issues then the trip gets a positive review, if not it receives a negative review. The results are then sorted by the cost figure and sorted so that the most expensive trip is displayed first.
The final section of the report was to use Compass and Atlas and replicate some of the simple and aggregation queries. For both Compass and Atlas in the report I have detailed the set up process and how I got the project data to a stage where it could be used to answer some questions. Each snip is labelled and accompanied by a short explanation of why it's useful/helpful.
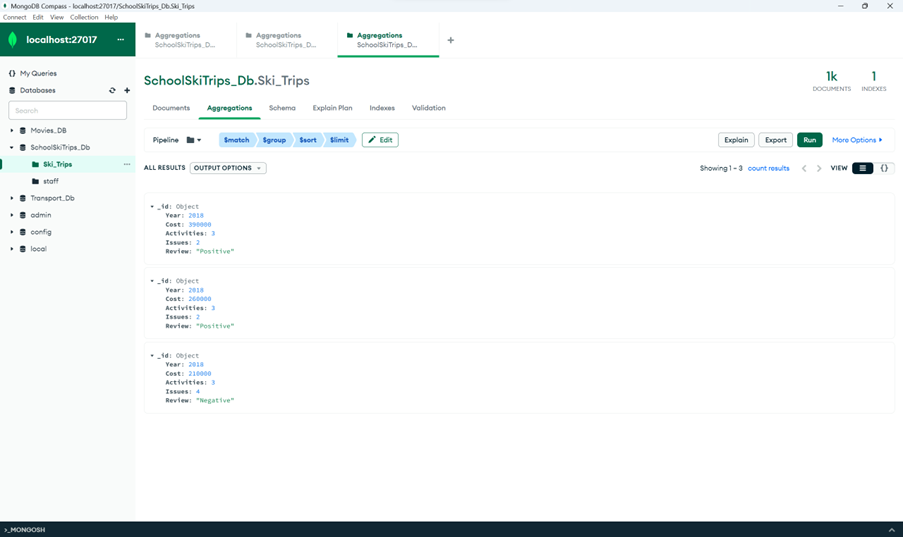
The above snip shows the output of the aggregation pipeline for the above section written in Compass. The pipeline remains the same, with 4 stages but just needs some slight reformatting from the shell. However the results are the same, with two positive reviews and one negative.
A feature of Atlas that I explored is the Atlas charts feature. This section of the Atlas home page allows you to create customised charts and dashboard using the collections in the database. After working with a number of different chart types I was quickly able to create an interactive dashboard using Atlas. The image below demonstrates a part of this dashboard:

Whilst the dashboard is not as intuitive as other data visualisation software such as Tableau, it was relatively simple to pick up and learn, and I was quickly able to create a dashboard that, with a little more work in terms of how it looks, could be presentable to senior management within a company.
As part of the report I generated two screencasts, one demonstrates the aggregation framework in the shell and the other explaining Compass and Atlas. Both videos can be viewed below on my YouTube channel:
You can view the main project report, initial database setup and JSON file on the below Google drive folder.
https://drive.google.com/drive/folders/171j30IXYyuQhKZN0ZoFPfHgJ5sq2duj5?usp=drive_link
