The aim of this college project is to explore and prepare chosen datasets and conduct three analyses using the following techniques:
A short video summary of the project is available on YouTube at the link at the bottom of this page.
Two datasets were downloaded from UCI for the purpose of the project, one for Classification and one for Regression. For classification the Bank Marketing Data from UCI was used. The data is related with direct marketing campaigns of a Portuguese banking institution. The marketing campaigns were based on phone calls. Often, more than one contact to the same client was required, in order to access if the product (bank term deposit) would be (‘yes’) or not (‘no’) subscribed. The file that contained 41188 instances of calls with 21 features relating to the clients data, last contact of the current campaign and social and economic context attributes.
After importing the data, to learn more about the dataset, a number of methods were used to investigate it.
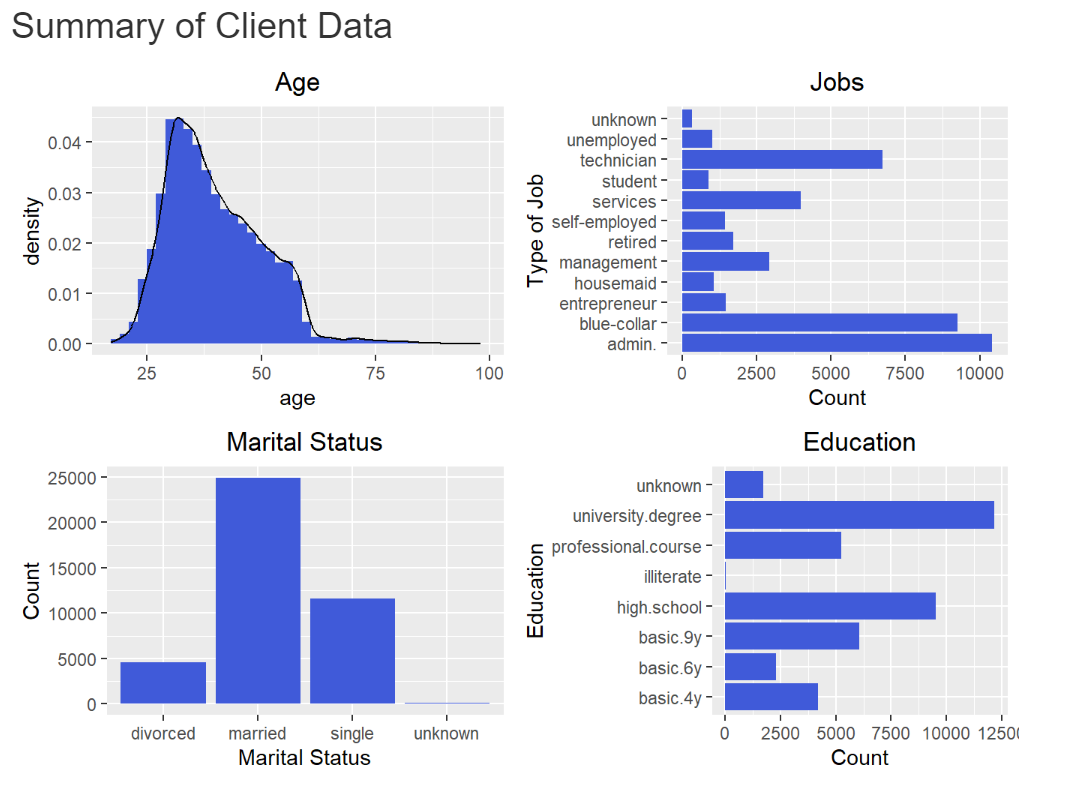
As can be seen from the charts below the most frequent features in the sections are around 30 years of age, in an administration job, married and have a university degree.
The below charts show that as expected it is most uncommon for credit to be in default, that around half the people called had a housing loan and that the majority of individuals called did not have a personal loan

The term “no” appeared 36,548 times and “yes” appears 4,640 times. The proportion of the two outcomes is 88.73% “no” and 11.26% “yes”. This difference can be better seen on a bar chart.

From this chart we can clearly see that there are a much larger number of “no” responses. Now we will look to use this data in classification techniques.
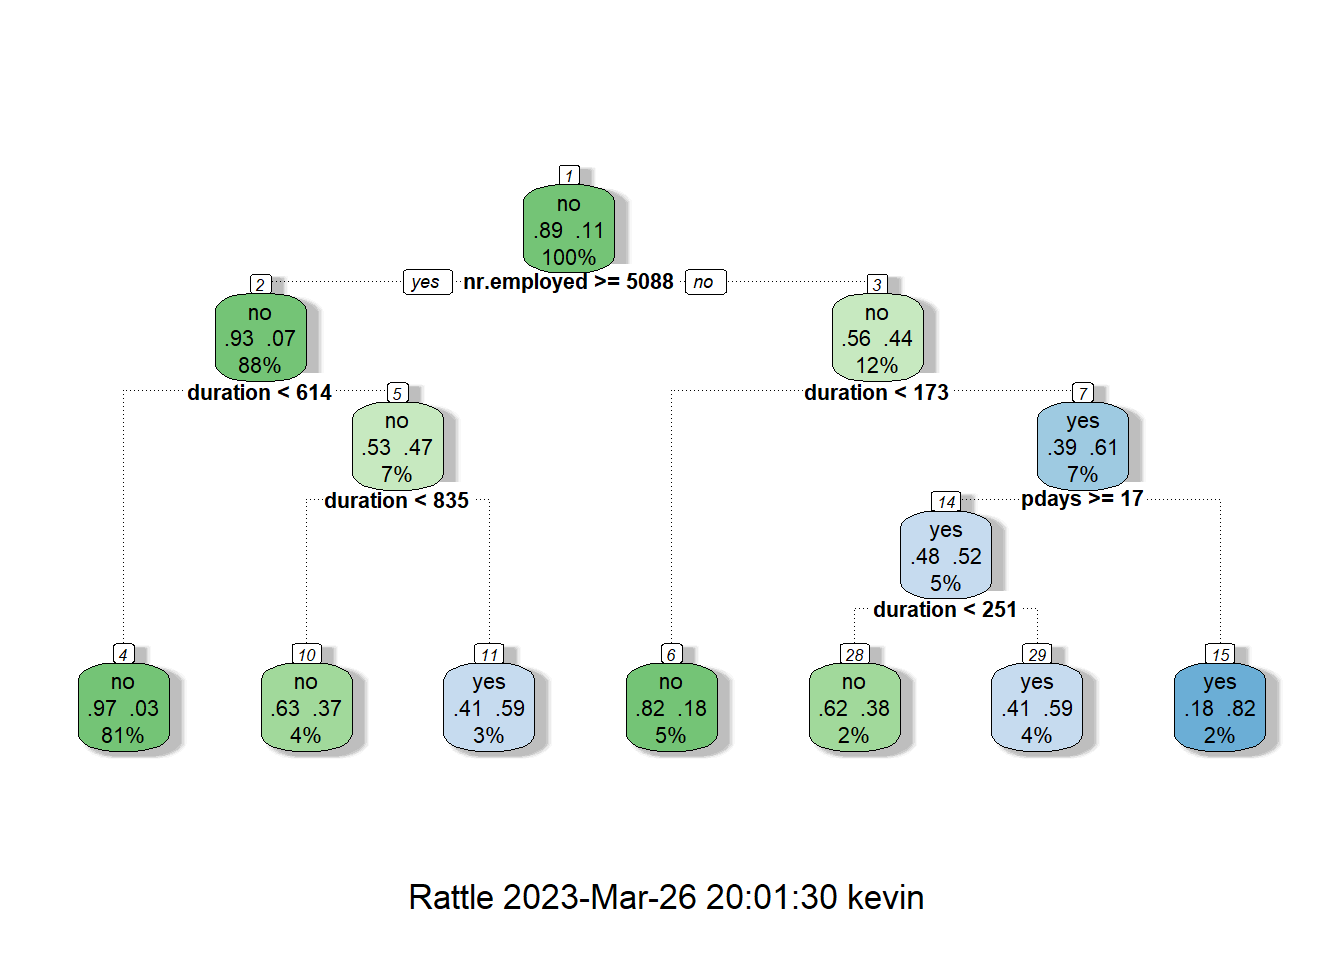
From the original data the proportion of ‘no’ responses was 88.73%. Therefore if the model predicted no for every response it would be 88.73% accurate, meaning the model had to beat this benchmark. The final decision tree model had an accuracy of 91.02%, meaning it would be an improvement over classifying all instances as no. The Model accuracy decreased by 0.3% through pruning, however, the final model is far simpler and by Occam's Razor should be used moving forward.
In regards to the model itself it is interesting that the external factor number of employees is chosen as the first split, clearing showing that there may be a correlation between economic performance and individuals preferences in depositing in banks or spending, more so than in relation to the clients data.

In the output above we can see that 5,369 iterations were correctly identified as being ‘No’ and 603 iterations were correctly identified as being ‘Yes’. However, 1,937 iterations were incorrectly classified as ‘No’ and 328 iterations were incorrectly classified as being ‘Yes’.
So while we have arrived at the proportion of ‘No’ and ‘Yes’ outcomes we were hoping for, there are a number of misclassifications.
Compute model accuracy rate on test data
Accuracy of a model is predicted by adding together the true positives and true negatives (all correctly classified iterations) and dividing it by the total number of iterations.
The accuracy of this model, or the percentage of the correct predictions made, is 72.16%, much lower than the near 90% benchmark. However we can analyse other performance metrics using a Confusion Matrix.
As part of the report I created a short summary. The video videos can be viewed below on my YouTube channel:
You can view the main project report in PDF format and look at the initial datasets on the below Google drive folder.
https://drive.google.com/drive/folders/1VLbs7dZSsK0m4_aIK9tR0H5oo4PaUt19?usp=drive_link
